As I was wrapping up a few bugs on a highly-anticipated new feature, I received a ticket from QA citing that our brand new feature took over 1 minute and 24 seconds to render a certain page! What’s strange is that, this feature utilized an existing Rails model that hadn’t been identified as being particularly slow or non-performant.
As with any terrible performance issue, I did the most important first step: see it with my own eyes.
Sure enough, I navigated to the suspect page, and sure enough, it took well over a minute to load. Oddly enough, the request never timed out——the page did eventually load!
I hopped over to Datadog to check out what was going on. Usually with issues like this, it’s difficult to get a get reading from logs or network requests alone. Typically, you’ll want some system-level observability that allows you to isolate different parts of the system and see how they interact.
In this case, I was quickly able to identify my problem-child of a request by limiting my requests to the past 5 minutes and then sorting by total time elapsed in the span.
Using the Flame Graph view, Datadog made it pretty easy to see the root issue.
When creating a new instance of this model (in the #create action), 90% of the request time was somehow spent in the #index action!
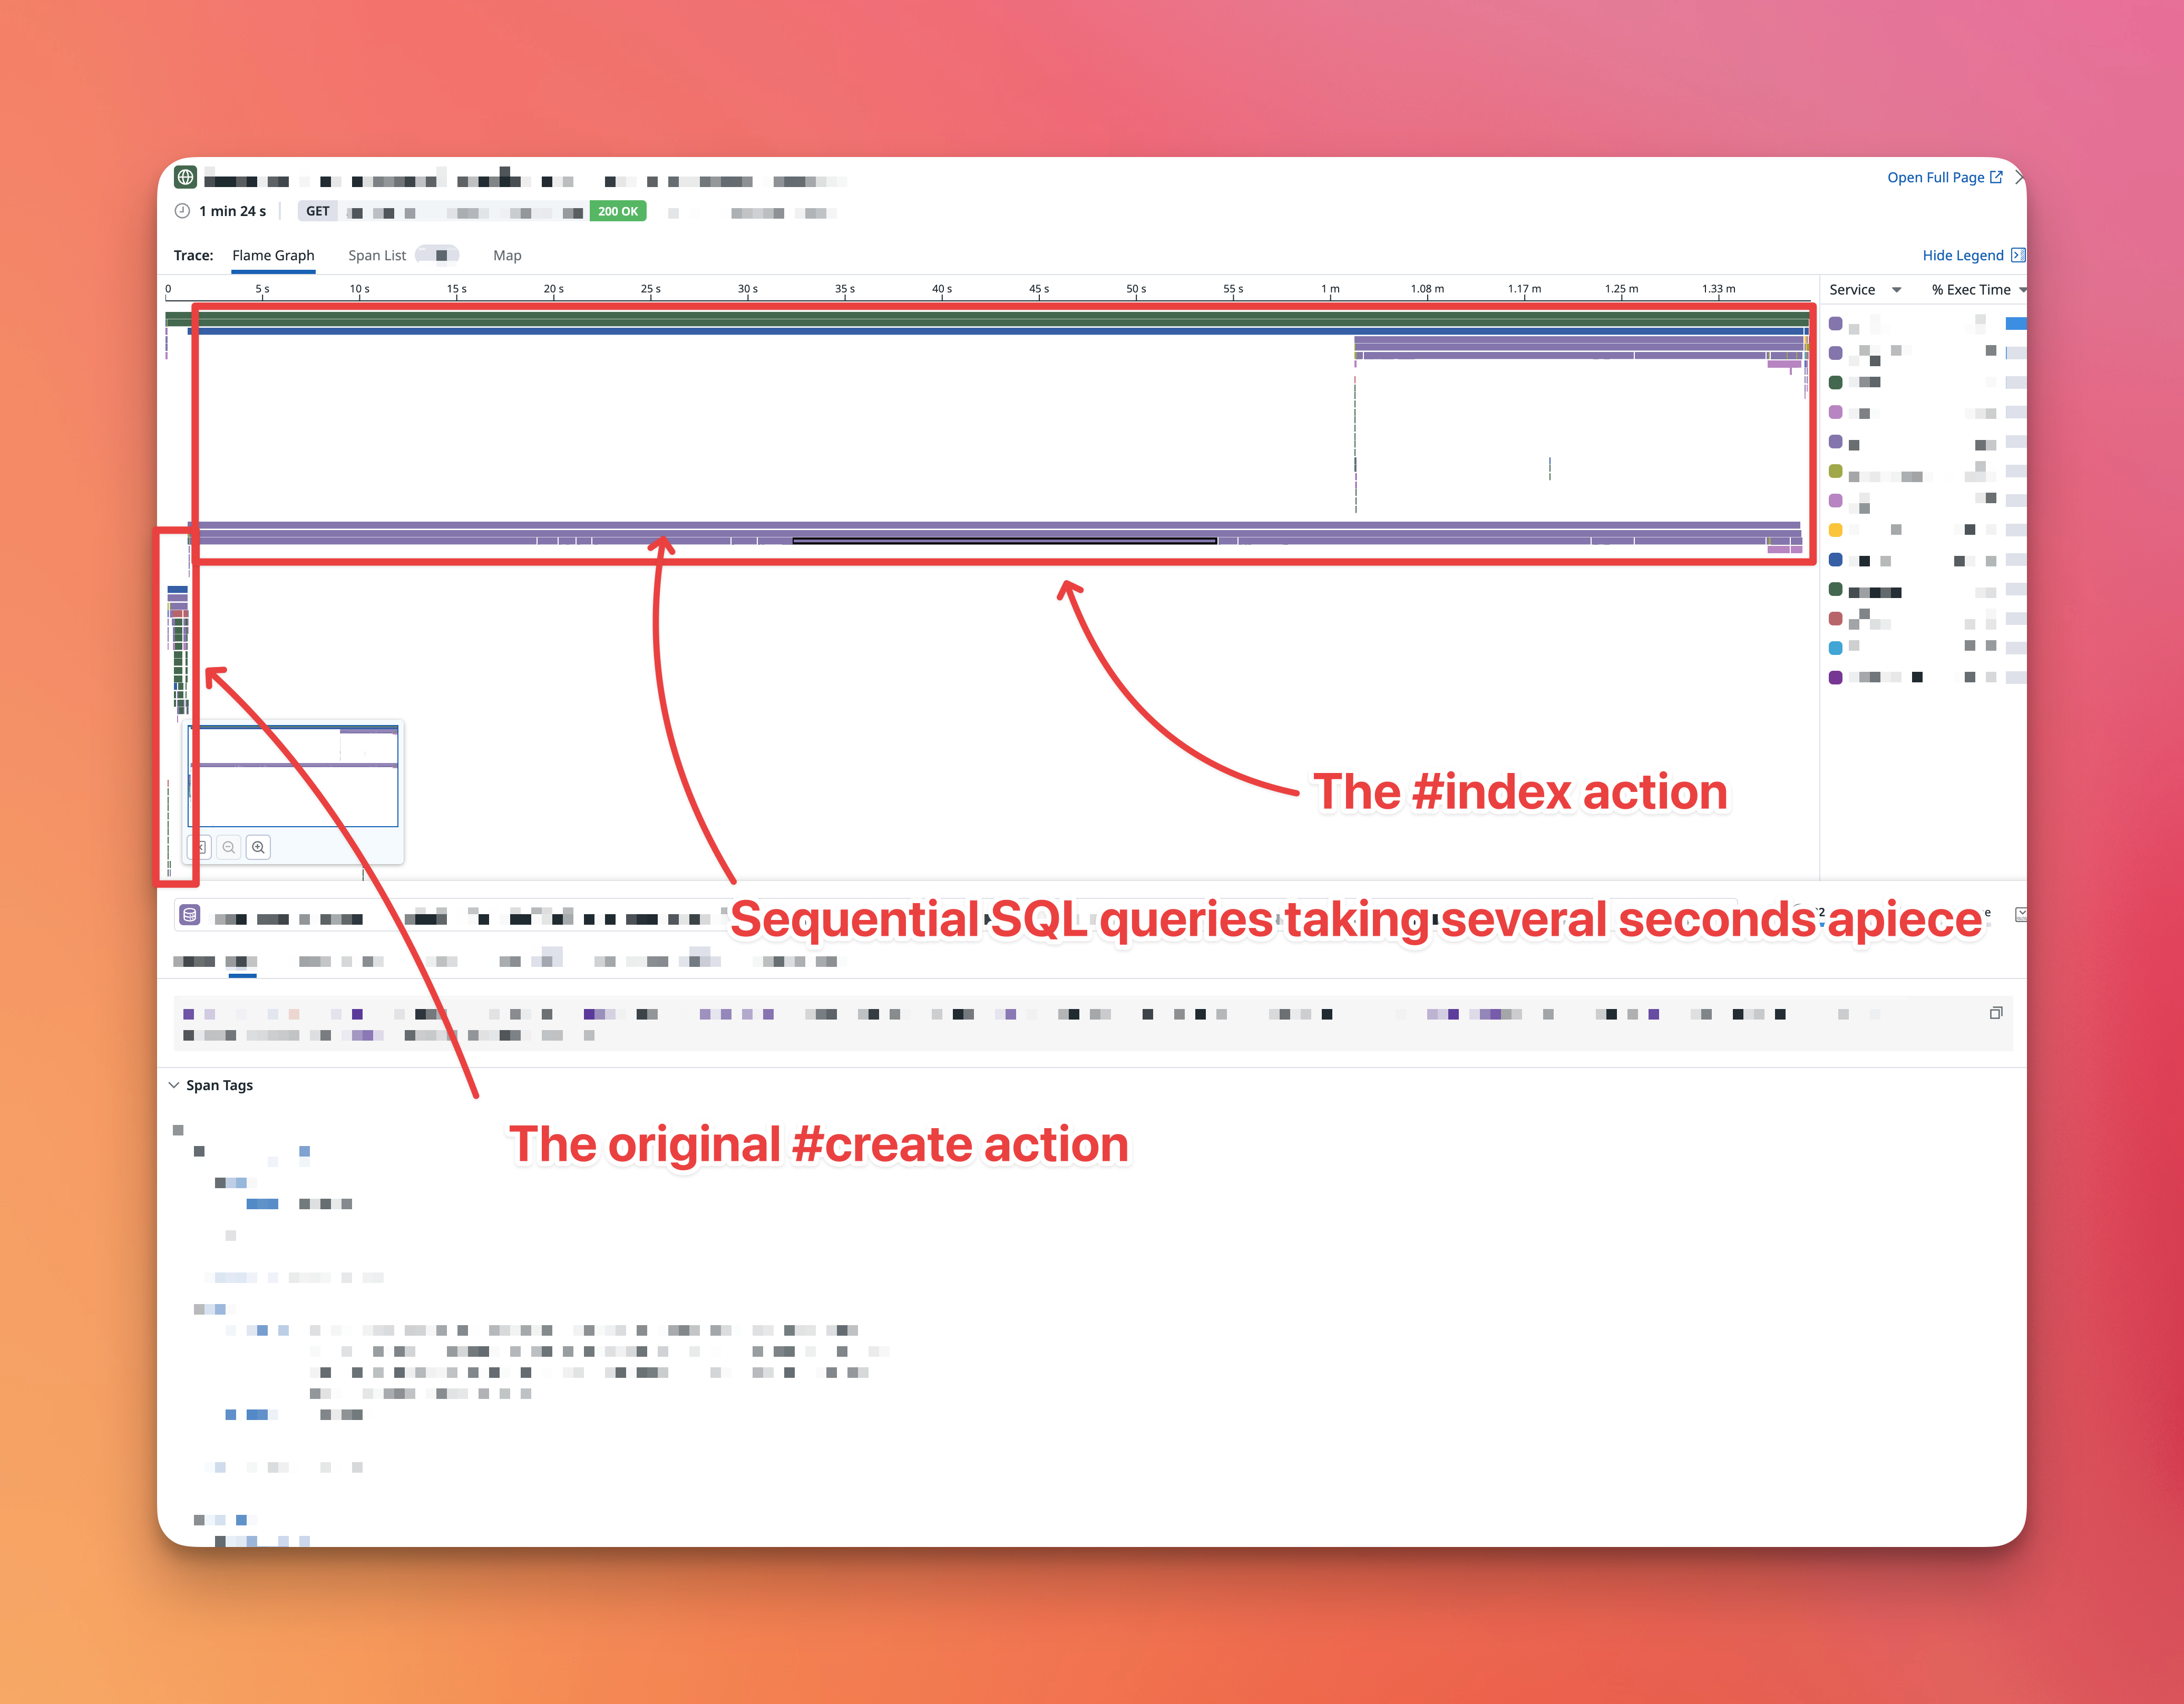 The names have been changed to protect the innocent.
How was this even possible?
I eventually traced through the request in Datadog until I found the culprit.
Having a tool that allows you to see inter-service traces is very important in distributed systems (especially micro-service architectures), because many times it’s the interactions between the “parts” that cause the “whole” to appear buggy. In this case we had an internal “gateway” service that handled the initial request before delegating the #create action to the core delivery service. It was this gateway service that made the subsequent #index call to the delivery service. Without this insight I would’ve spent a lot of time chasing my tail trying to figure out how the create action somehow “redirected” to the index action (which of course wasn’t actually happening).
We were intentionally grabbing every single instance of this Model after creating a new instance because of an obscure product requirement implemented a couple years ago where we wanted to use the state of the newly-instantiated Model to possibly update or modify all existing Models for a given client.
Good Engineering Practice™
Do not perform long-running logic within an HTTP request context!
It’s almost always a bad idea to do very computationally-intensive logic within the lifecycle of an HTTP request. In this case, there was no reason we couldn’t extract the logic into a background worker. And so that’s exactly what I did.
We could confidently ensure that moving the logic to a background worker was an appropriate solution given the product requirements, despite both the original product owner and engineer no longer working at the company.
Also Good Engineering Practice™
Ensure your commits include references to applicable decision documents and/or references.
Too often, commits are made quickly without much thought to the constraints or mindset behind the change. This can create difficult situations years down the road when someone needs to understand the context of a given technical decision. Thankfully, this engineer linked to the Jira ticket that prompted the changes. This allowed me to be able to confidently ensure we weren’t interrupting any product features while refactoring the logic into a background worker.
I solved this issue by moving the logic into a background worker which eliminated the HTTP request delay.
As an added bonus, by moving the logic into a worker belonging to the Delivery service, and not the Gateway service, I was able to avoid calling the #index action at all.
This meant the actual logic itself (now running in the background service), was MUCH faster, as we could just skip all the non-essential metadata queries that take so long in the #index action.
There is still the outstanding issue: why is the #index action so slow in the first place?
As it turns out, we have several (7+) database queries that were taking 10 seconds or longer to complete. Most of these queries were related to building up metadata pertaining to the Model in question. This metadata is important when displaying the index view of the model, but is usually assisted by the fact that we paginate the index view——hence avoiding 80+ seconds of query-time.
As I dug further, it turns out we have a few outstanding tickets to investigate the slowness seen in this particular Rails Controller, and I had unwittingly stumbled on the root cause——unoptimized database queries.
I’m not a database expert, but in my experience, DISTINCT COUNT queries can easily become performance goblins.
The solution usually depends on the exact product requirements, but I’m crossing my fingers that the final solution will be this easy: https://stackoverflow.com/a/14732410/6535053
However, I haven’t begun that work yet, so time (and hopefully this blog) will eventually tell!
Thanks for reading! If you enjoyed this, you may also enjoy following me on twitter!